Where travel agents earn, learn and save!

No data found
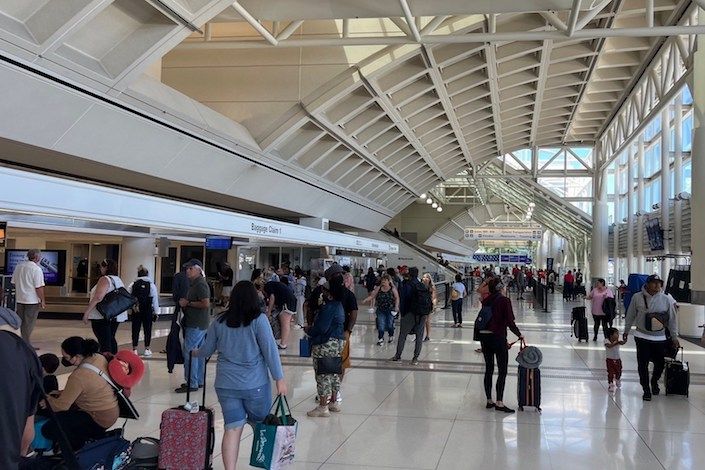
News / Ontario International Airport passenger volumes continued to soar in September, exceeding pre-pandemic levels by 10%
More than 500,000 travelers flew into or out of ONT for a 5th straight month
Southern California's Ontario International Airport (ONT) surpassed pre-pandemic levels for the seventh straight month in September as passenger volumes continued to climb to levels not seen since 2007, airport officials announced.
Nearly 517,000 air travelers flew into or out of ONT during the month, 10.15% more than the same month in 2019. It marked the fifth consecutive month in which passenger volumes exceeded a half million, and moved Ontario closer to a possible 6 million passengers by year's end. The September total also represented a 6,000-passenger increase over August – typically a peak month for air travel.
Through the first nine months of the year, ONT welcomed 4.2 million passengers – 3.6% more than the same period in 2019 and 37.6% above last year. At this pace, the airport should well exceed the 5.6 million passengers who flew into or out of ONT in 2019 – the last full year before the pandemic. According to Ontario's seat capacity projections for the next six months, nonstop flights are expected to increase by 1.6% over the October 2019-March 2020 time period, nonstop seat capacity is projected to rise by 7.9%, and available seat miles (ASMs) are projected to increase by 11.4%.
This continues an impressive trend that began with the airport's return to local ownership in 2016. During those first three years – before COVID-19 disrupted air travel globally – ONT experienced a nearly 33% increase in passenger volumes.
Passenger Totals | Sep 2022 | Sep 2019 | Change | YTD 2022 | YTD 2019 | Change |
Domestic | 502,540 | 446,169 | 12.63 % | 4,072,713 | 3,838,865 | 6.1 % |
International | 14,405 | 23,155 | -37.79 % | 136,803 | 223,889 | -38.9 % |
Total | 516,945 | 469,324 | 10.15 % | 4,209,516 | 4,062,754 | 3.6 % |
Passenger Totals | Sep 2022 | Sep 2021 | Change | YTD 2022 | YTD 2021 | Change |
Domestic | 502,540 | 440,947 | 13.97 % | 4,072,713 | 2,980,026 | 36.7 % |
International | 14,405 | 12,227 | 17.81 % | 136,803 | 79,186 | 72.8 % |
Total | 516,945 | 453,174 | 14.07 % | 4,209,516 | 3,059,212 | 37.6 % |
The September numbers also underscored Ontario's role as a global logistics hub. Shipments of air cargo totaled more than 70,000 tons during the month, 14.4% higher than the same month in 2019. Last month's tonnage was essentially flat when compared with September a year ago.
For the first nine months of the year, air cargo volume was more than 618,000 tons, 11% more than the same period in 2019.
Air cargo (tonnage) | Sep 2022 | Sep 2019 | Change | YTD 2022 | YTD 2019 | Change |
Freight | 65,831 | 59,918 | 9.87 % | 577,554 | 539,062 | 7.1 % |
4,196 | 1,271 | 230.12 % | 41,059 | 18,221 | 125.3 % | |
Total | 70,027 | 61,189 | 14.44 % | 618,613 | 557,283 | 11.0 % |
Air cargo (tonnage) | Sep 2022 | Sep 2021 | Change | YTD 2022 | YTD 2021 | Change |
Freight | 65,831 | 66,380 | -0.83 % | 577,554 | 609,952 | -5.3 % |
4,196 | 4,269 | -1.71 % | 41,059 | 34,426 | 19.3 % | |
Total | 70,027 | 70,649 | -0.88 % | 618,613 | 644,378 | -4.0 % |